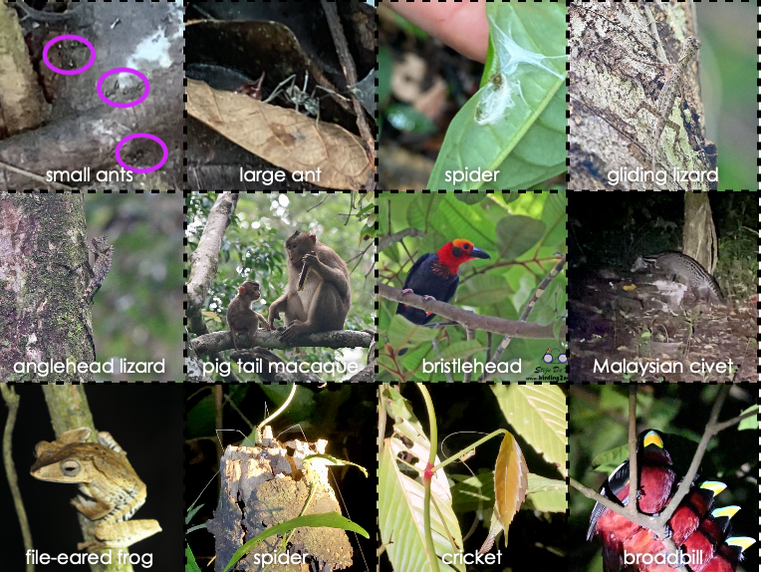
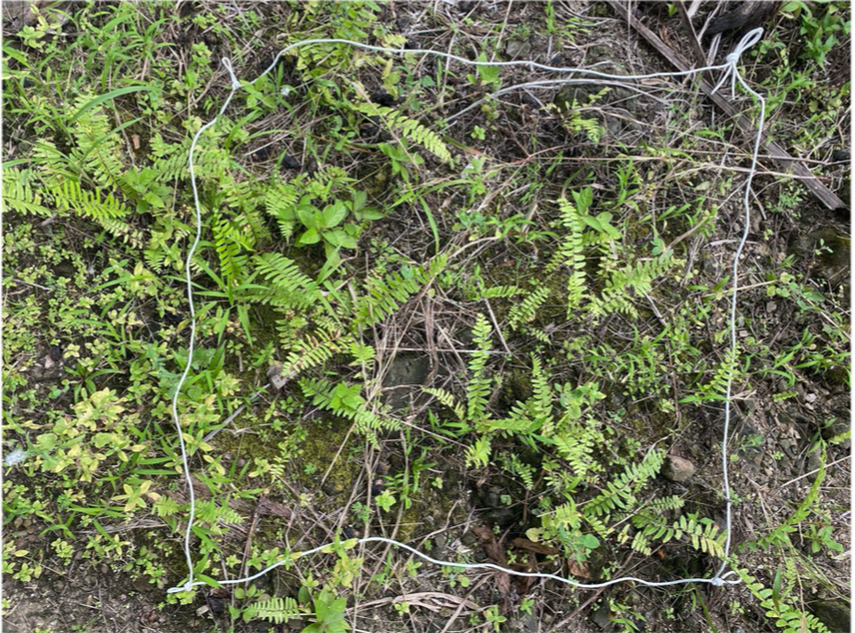
Biodiversity Data: Organize and Analyze!We are asking students to help us analyze some data on this mission! We will be sharing daily photos of the forest floor, understory, and canopy so students can determine if plant diversity is low, medium, or high, at each of those levels. Log in and check out the Day 3 lessons on the PreMission page for support with analyzing the data. Check back on this page for additional photos to analyze as the mission progresses! We will also use this page to share animal photos students can use to track animal biodiversity. With distance learning in place, it might be simplest to share pdfs with students, while you maintain a hard copy. Ask students to weigh in about how to short and classify the animals then attach photos to your chart as they direct. You can share photos of the progress with them or take a look during a classroom video call. Please let us know about the creative ways you are interacting with students around this data. The good news about this mission is that the data should be pretty clear cut, so even if you decide to skim over this analysis your students should be able to draw some conclusions about the hypothesis anyway. Your analysis could be as simple as tally marks of how many different animals you see in the photos at the end of each video. Remember to be kind to yourselves and cut back when you need to. 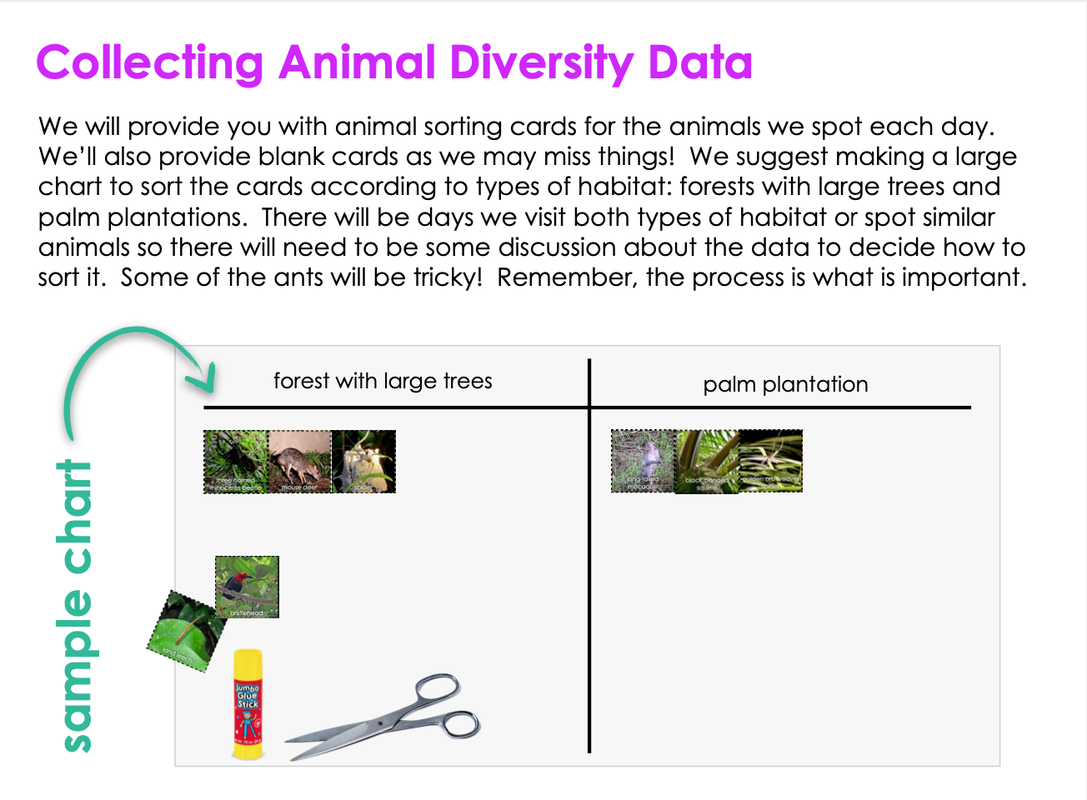 Download the photographic evidence below!
0 Comments
Your comment will be posted after it is approved.
Leave a Reply. |
Meet Beth and Curtis!Presidential Award-Winning teacher and hula hoop fanatic, Beth loves bringing real world science to kids! Beth is fascinated by engineering challenges, technology, and outdoor learning spaces. After 25 years teaching kindergarten, she’s excited to share her passion and experience on-line with classrooms from around the world! Archives
May 2021
Categories
All
|
 RSS Feed
